|
|
|
|
| |
|
|
|
|
|
Year 2003Nov. 22 |
What did the MTA strike cost me?
The Los Angeles MTA (Metropolitan Transportation Authority) runs the L.A. County buses and trains which I ride every day to school at USC. On October 14, they went on strike for 35 days. I had to drive to USC. Earlier this week, the strike ended. I decided to calculate how much in extra gas this strike cost me, and in general, to figure out how much gas money I'm saving by taking public transportation five days a week.
How much did it cost me? Answer: Nothing. It saved me $31.68.
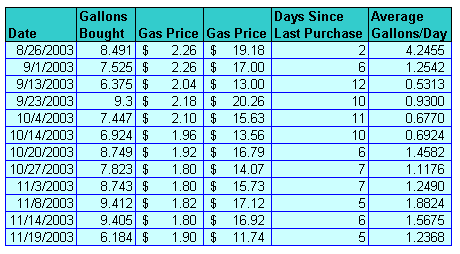
During the 43 days between when school started and the strike began, I averaged 0.699 gallons per day, or $1.45/day. During the 36 days of the strike, I averaged 1.398 gallons per day, or $2.57/day. So that cost me $40.32 more than usual. However, because of the strike, I did not have to buy a bus pass for November because they're going to honor my October pass through the end of the year. So that saved me $72.00. So my net gain was $72-$40.32 = $31.68. This doesn't count the wear & tear on my car, however. But then, there will also be some days in December that I won't have to pay bus fare.
In contrast, the mechanics who originally went on strike lost about $5000 in wages.
Here is a chart that shows my gas usage during up to the current point in the semester.
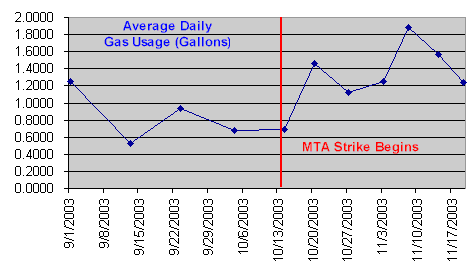
The chart doesn't show much, I guess. That's why I looked at the numbers for the whole time, which I used above. Here's the raw data I used (gathered from Quicken):
I also made some more general charts about gas price and my usage.
Gas Prices and My Gas Usage
While I was doing these calculations, I thought it would be fun to also see how much I use gas in general, and how much it costs. Here are some charts.
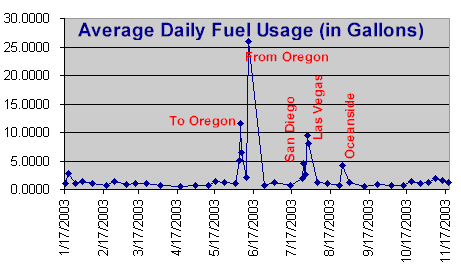
Average Daily Fuel Usage.
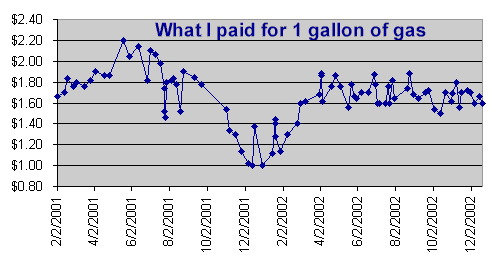
What I paid for a gallon of gas, Feb 2001 to December 2002
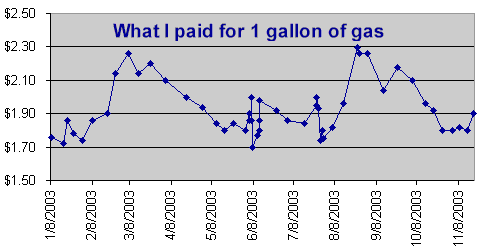
What I paid for a gallon of gas, Jan 2003 to November 2003.
I had forgotten that gas was as expensive at the beginning of 2001 as it is now, and that it dropped dramatically around the end of 2001. Also, the chart of my gas usage shows that it's the big trips that change my usage more than anything, and in comparison, my daily driving doesn't change much.
![]()
Created and maintained by Matthew Weathers.
Last updated Apr 20, 2006.
![]()